|
| |
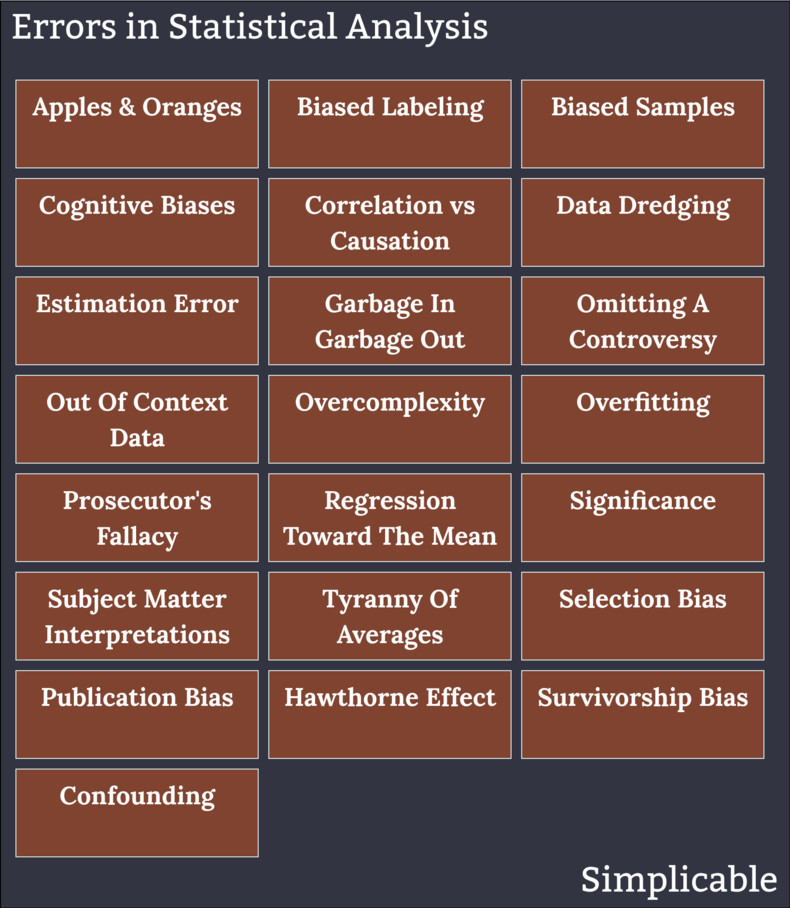
There are three kinds of lies: lies, damned lies and statistics. ~ Mark Twain A misuse of statistics is a pattern of unsound statistical analysis. These are variously related to data quality, statistical methods and interpretations. Statistics are occasionally misused to persuade, influence and sell. Misuse can also result from mistakes of analysis that result in poor decisions and failed strategies. The following are common misuses of statistics.
Apples & Oranges Comparing things that are not comparable or using unfair or impractical criteria of comparison.Biased Labeling Misleading labels on a graph.Biased Samples Poor quality samples such as answers to leading questions.Cognitive BiasesMisinterpretations of numbers due to flawed logic such as cognitive biases.
Correlation vs Causation The invalid assumption that because two things are correlated that one causes the other.Data DredgingLooking for patterns in data using brute force methods that try a large number of statistical models until matches are found. Data dredging has valid applications for exploratory data analysis. However, it is generally considered poor practice to draw conclusions using data dredging as it tends to find random patterns that are meaningless.Estimation Error Neglecting estimation error in results.Garbage In Garbage OutLow quality data produces low quality statistical analysis.Omitting A Controversy Failing to mention controversial assumptions in your data. For example, representing the result of a particular IQ test as "intelligence."Out Of Context Data Using data without understanding its context. OvercomplexityGraphs and data visualizations that are too complex to be interpreted by your audience. This may prevent data from being challenged and validated.OverfittingTesting too many theories against data such that random patterns are sure to be found.Prosecutor's Fallacy A general term for an invalid interpretation of a valid statistic.Regression Toward The Mean The tendency for extreme sets of results to become more average as the set grows. Neglecting regression toward the mean is a common error of statistical analysis.SignificanceBasing analysis on a statistically insignificant number of samples.Subject Matter Interpretations Interpretations that are made without input from an expert on a topic. For example, a data analysis that suggests a particular vitamin has health benefits that is performed by a statistician without involvement of medical doctors and other professionals who might spot errors and alternative explanations for observed data.Tyranny Of Averages A tendency for averages to convey little practical information about a data distribution. For example, an average is often greatly influenced by outliers in data.Selection BiasUsing a sample that is not representative of an entire population. For example, if you ask for volunteers for a study about personality this would likely contain a selection bias because people who volunteer for studies may have different characteristics from the general population.Publication BiasA tendency for studies with dramatic results to be published while studies that confirm conventional theories are not.Hawthorne EffectThe Hawthorne effect is a tendency for people to modify their behavior while they are participating in a study. For example, if you are participating in a study that measures productivity, you may tend to work harder.Survivorship BiasConsidering only the winners in a particular population. For example, looking at the historical returns of all companies currently in a stock index without considering companies that were dropped from the index due to poor performance.ConfoundingConfounding occurs where it looks like there is a relationship between two variables because some third unidentified variable affects both. For example, if you find that people who drive grey cars get in less accidents, you might look for a confounding variable such as the average age of people who purchase a conservative color such as grey.SummaryNext: Prosecutor's Fallacy
More about statistical analysis:
If you enjoyed this page, please consider bookmarking Simplicable.
© 2010-2023 Simplicable. All Rights Reserved. Reproduction of materials found on this site, in any form, without explicit permission is prohibited.
View credits & copyrights or citation information for this page.
|