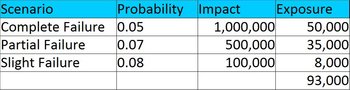
A risk probability is the chance that a risk will occur. By definition, a risk is a probability of a loss. As such, risks are modeled with probabilities and impacts. The following are common ways to model risk probability.
Qualitative Probabilities
In many cases, a risk probability is an educated guess that is modeled with a rating system such as low, medium and high probability. For example, a project team may identify risks and rate them according to the expert opinion of team members.
Quantitative Probabilities
A detailed risk analysis may allow a number to be assigned to risk probabilities. These are typically a percentage such as 60% represented as 0.6.
Discrete Probability Distributions
A single risk often has multiple probabilities associated with it. For example, a fire risk can range from a building completely burning down to minor damage. It is common to break out the probability of each level of impact as a discrete probability distribution that can be represented as a table of probabilities and impacts.
Continuous Probability Distribution
A discrete probability distribution lists out a number of probabilities and associated impacts. For example, the chance of $2000 and $1000 fire damage might be listed in a table. A continuous probability distribution is a more accurate model that provides a probability for any impact such as the probability of $1033.37 of damage. This is represented as a mathematical formula and smooth curve as opposed to a table and a bar chart.
Cookies help us deliver our services. You have choices regarding these cookies. Please visit our privacy policy, cookie policy and consent tool to learn more.
Copyright 2002-2026 Simplicable. All rights reserved. This material may not be published, broadcast, rewritten, redistributed or translated. Report violations here.