Supply Curve
Supply is typically modeled as a curve that shows the quantity of a good that market participants are willing to supply at a particular price level.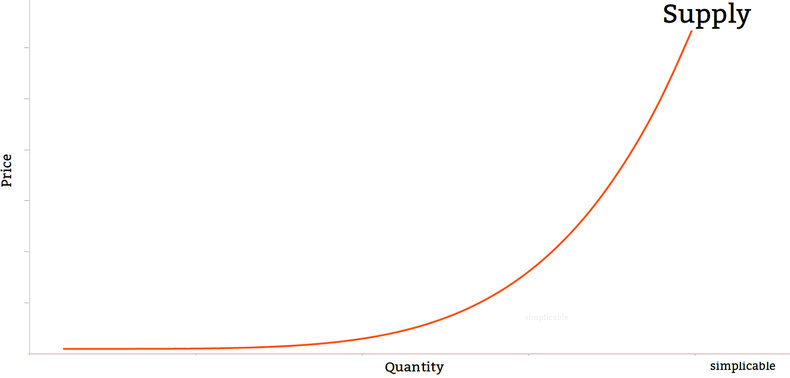
Supply & Demand
Supply curves are often modeled together with a demand curve that depicts the quantity that the market is willing to buy at a price. The point where these two graphs intersect is known as an equilibrium price. This represents the price and quantity that would be produced by an efficient market.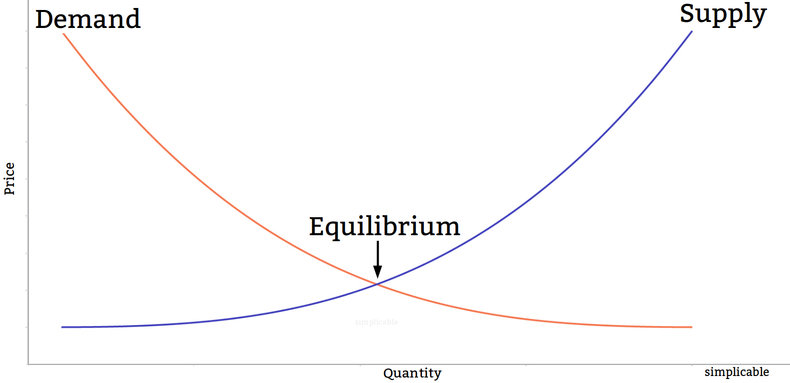
Business Cycles
As the price of a good goes up, firms and individuals have incentive to increase supply. This can take time and doesn't happen immediately as it can require building factories and other facilities such as mines. In many cases, it takes an industry years to adjust to higher prices by increasing supply. Multiple producers may invest in new capital when a price goes up. This can result in a sharp increase in supply months or years later that collapses the price resulting in declining capital investment. Industries commonly go through a cycle of high prices and undersupply followed by investment and a period of low prices and oversupply.Supply Shocks
A supply shock is a sudden drop in supply due to factors such as war, trade wars, disruptions, disasters or the exit of firms from a market . This can result in a large price increase that occurs quickly.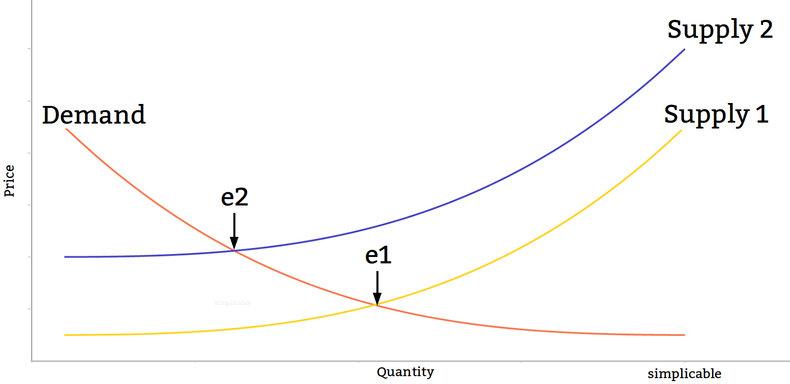
Types of Supply
Supply can include goods, services, labor, assets, securities and currency.| Overview: Supply | ||
Type | ||
Definition | Value that firms and individuals are willing to provide to a market for a price. | |
Related Concepts | ||


