

Supply Curve
A supply curve illustrates the relationship between price and quantity of supply for a product, service, commodity, asset, currency or other types of value such as labor.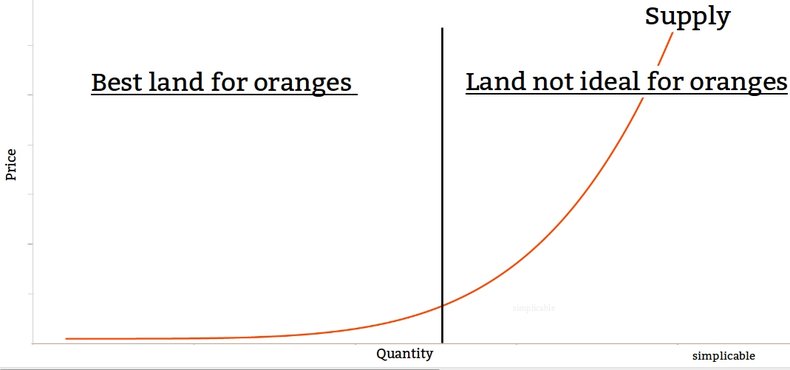
Demand
Supply is often modeled with a demand curve that shows the quantity demanded by the market at different price levels.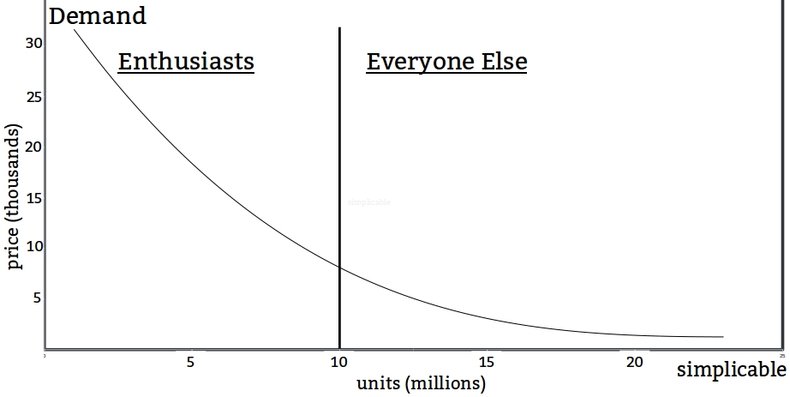
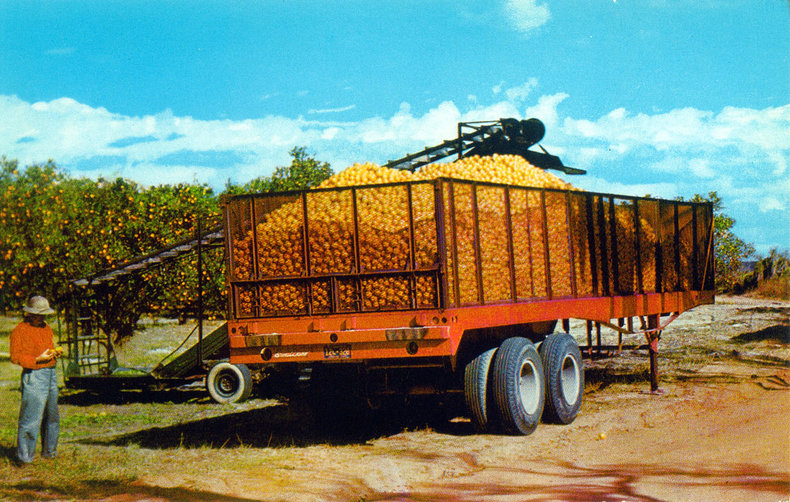
Commodity Prices
Commodities are goods and services for which individual buyers and sellers have little influence over price and must accept the market price. In the example below, suppliers are willing to provide 63 million tons of apples at a price of $303 a ton. At a higher price, farmers will devote more resources such as land, labor and capital to apples and the supply increases.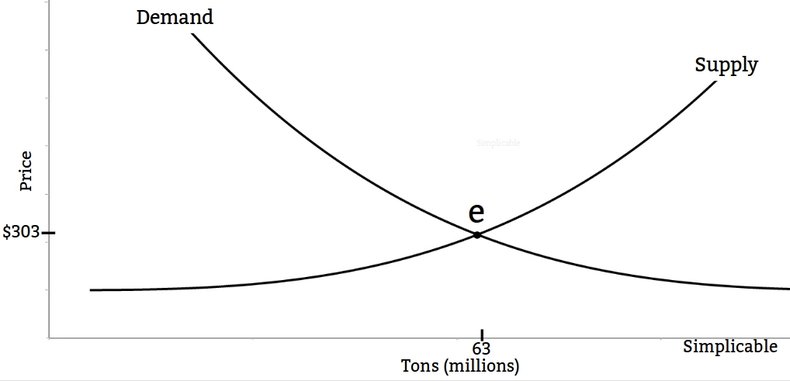
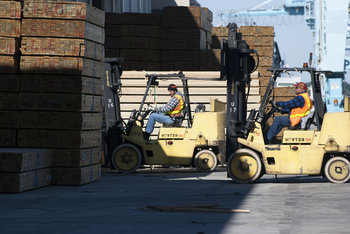
Labor Supply
Workers with a particular skill set are willing to provide 1.4 million hours of labor at a salary of $100,000. As the salary goes up more people will acquire the skill set and supply of available workers increases.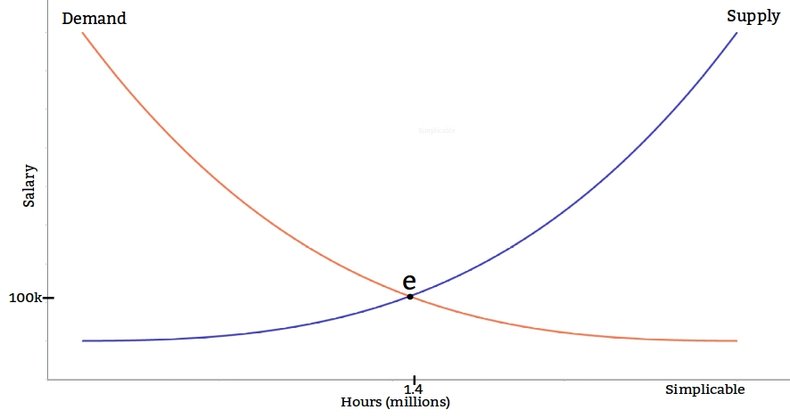
Supply Shock
A trade war results in a sudden drop in supply due to high import tariffs for a good. This results in an increased price and less consumption of the good as the equilibrium shifts from e1 to e2.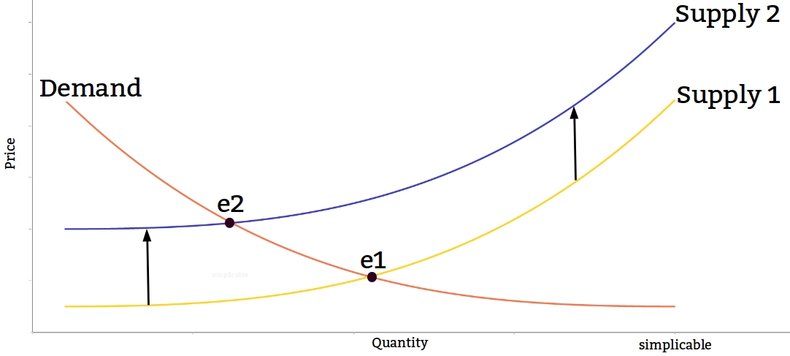
| Overview: Supply Examples | ||
Type | ||
Definition | The value that market participants such as firms and individuals are willing to provide at a price level. | |
Related Concepts | ||