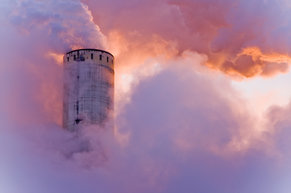
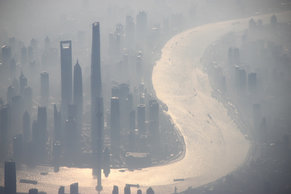
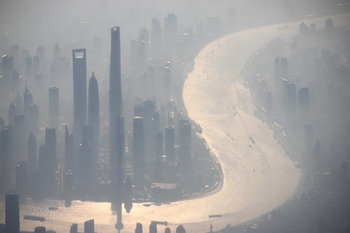
CO2 per capita is the carbon dioxide emitted by a nation divided by its population. Currently, this is very high in oil rich states such as Qatar, Kuwait and United Arab Emirates. In terms of highly developed countries, Australia, United States, Canada, South Korea and Netherlands currently have relatively high emissions as compared to peers with a similar GDP per capita. The following chart lists the CO2 emissions per capital for 50 countries.
Rank
Country
CO2 emissions (metric tons per capita)
1
Qatar
38.9
2
Trinidad and Tobago
31.8
3
Kuwait
25.0
4
Bahrain
22.2
5
United Arab Emirates
22.0
6
Saudi Arabia
17.4
7
Australia
15.5
8
United States
15.5
9
Canada
15.1
10
Oman
14.2
11
Kazakhstan
13.9
12
Estonia
12.6
13
Turkmenistan
12.5
14
South Korea
12.1
15
Russian Federation
12.0
16
Netherlands
10.0
17
Czech Republic
9.7
18
Japan
8.9
19
Germany
8.8
20
Belgium
8.6
21
South Africa
8.5
22
Finland
8.3
23
Iran
8.3
24
Mongolia
8.3
25
Malaysia
8.1
26
Ireland
7.9
27
Poland
7.9
28
Norway
7.8
29
Libya
7.8
30
Israel
7.6
31
New Zealand
7.3
32
China
7.2
33
Austria
7.0
34
Singapore
6.7
35
Bosnia and Herzegovina
6.5
36
Serbia
6.4
37
Belarus
6.1
38
Slovenia
6.1
39
Slovakia
6.0
40
Hong Kong SAR, China
5.9
41
Bulgaria
5.9
42
Greece
5.8
43
United Kingdom
5.8
44
Cyprus
5.7
45
Denmark
5.5
46
Venezuela
5.5
47
Italy
5.3
48
Spain
5.2
49
Iraq
5.2
50
Kosovo
5.0
Notes
Countries with a population below 1 million were omitted from the list for the purposes of meaningful comparison for large countries.All data is 2016 except Italy which is 2014.
27 Shares
Sustainability
This is the complete list of articles we have written about sustainability.
Cookies help us deliver our services. You have choices regarding these cookies. Please visit our privacy policy, cookie policy and consent tool to learn more.
Copyright 2002-2026 Simplicable. All rights reserved. This material may not be published, broadcast, rewritten, redistributed or translated. Report violations here.