|
| |
Global change is change to the environment, human society and economy that occur at planetary-scale. In many of these changes there is a clear pattern that change accelerates around the year 1950. This is related to the pace of technological advancement and population growth. Significant global changes can be identified that appear to be exponential or hyperbolic such that they do not appear to be sustainable. The following are examples of global change.
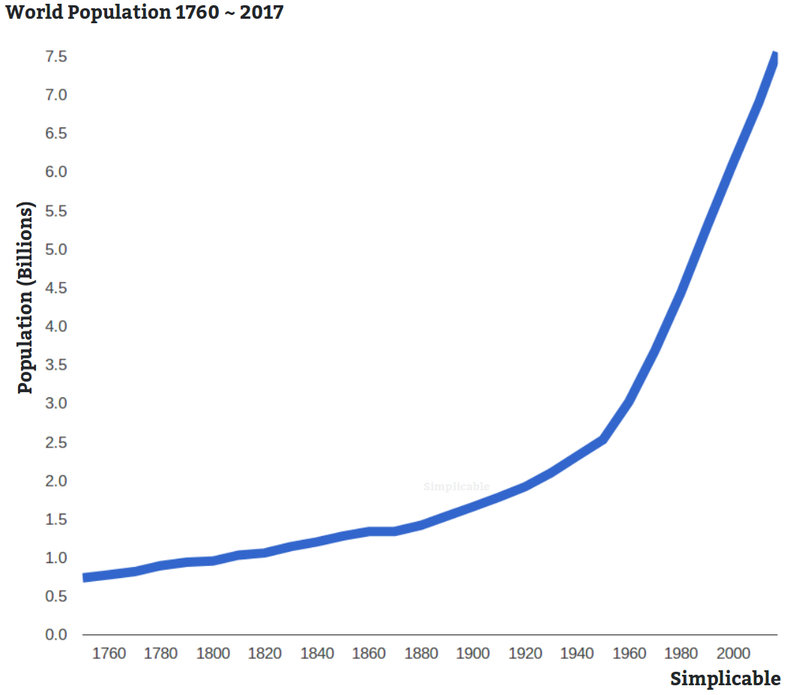
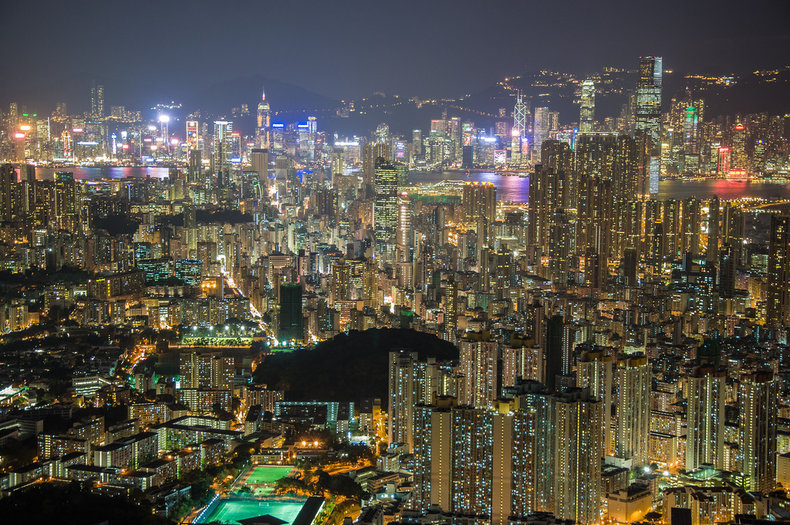
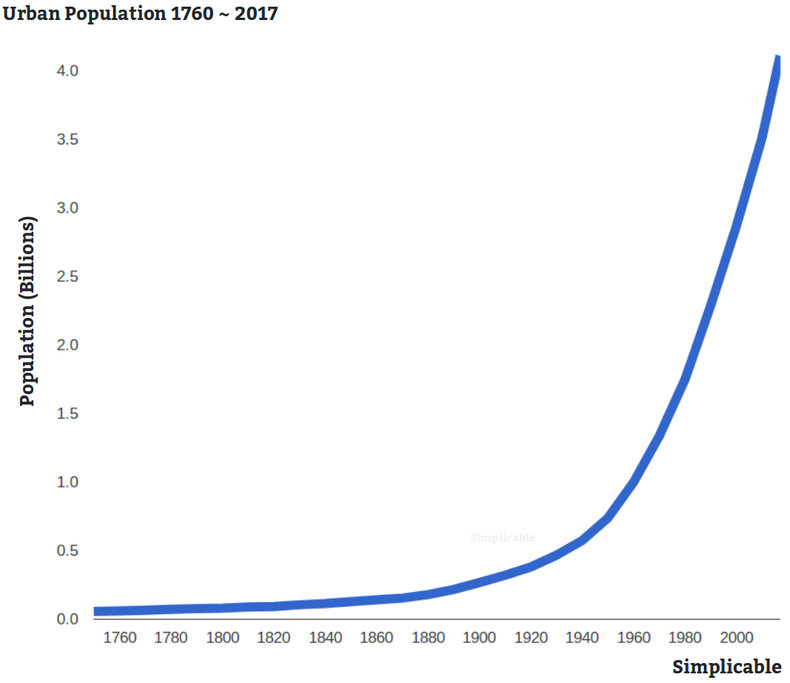
PopulationWorld population was 1.78 billion in 1910 and 6.90 billion in 2010. This represents a 100 year growth rate of 387% meaning that population almost quadrupled in a century.Urban PopulationPeople are moving to cities with 54.827% of the global population living in an urban area in 2017.
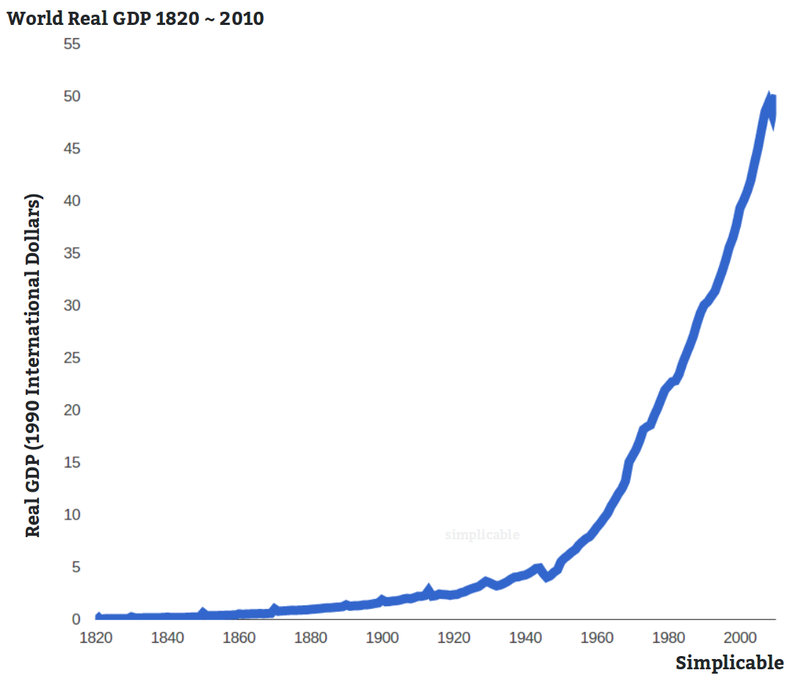
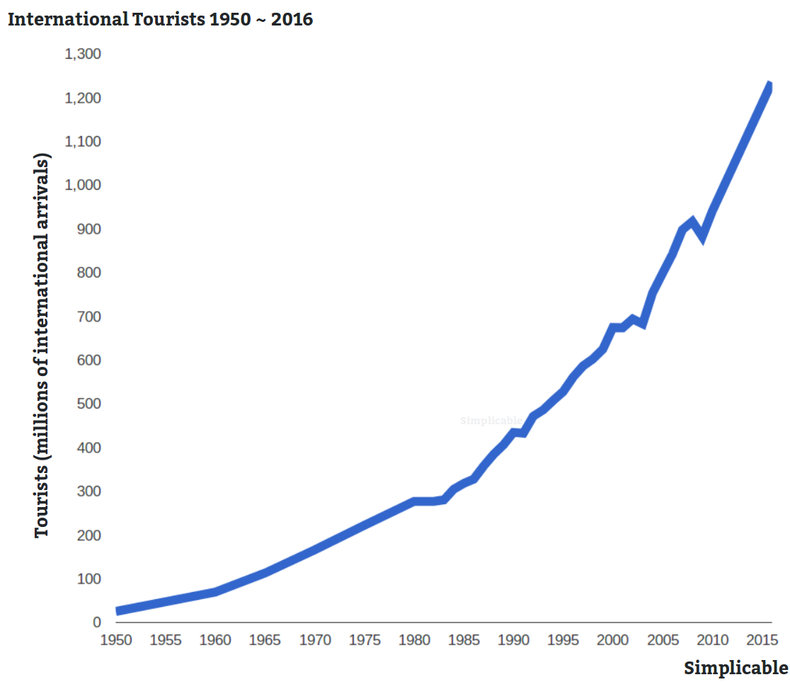
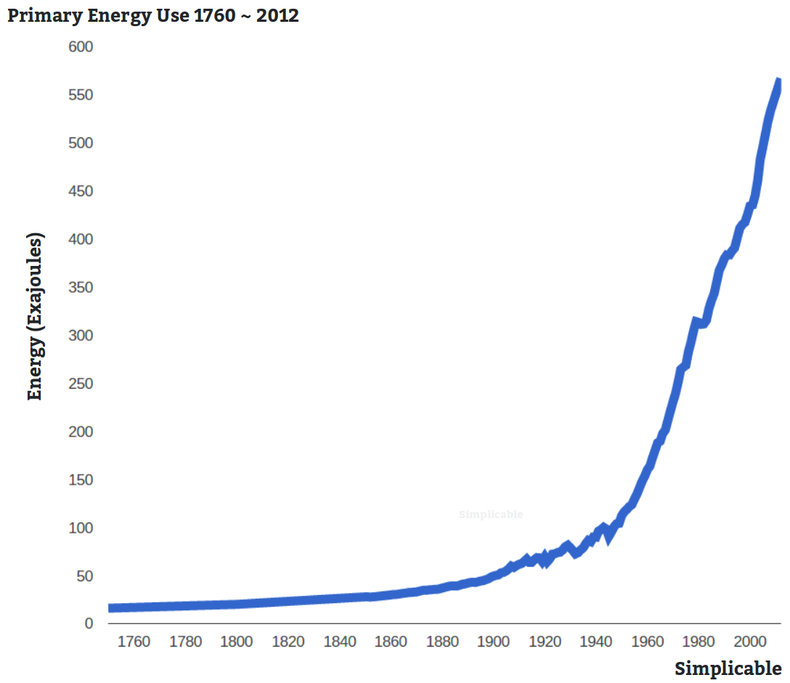
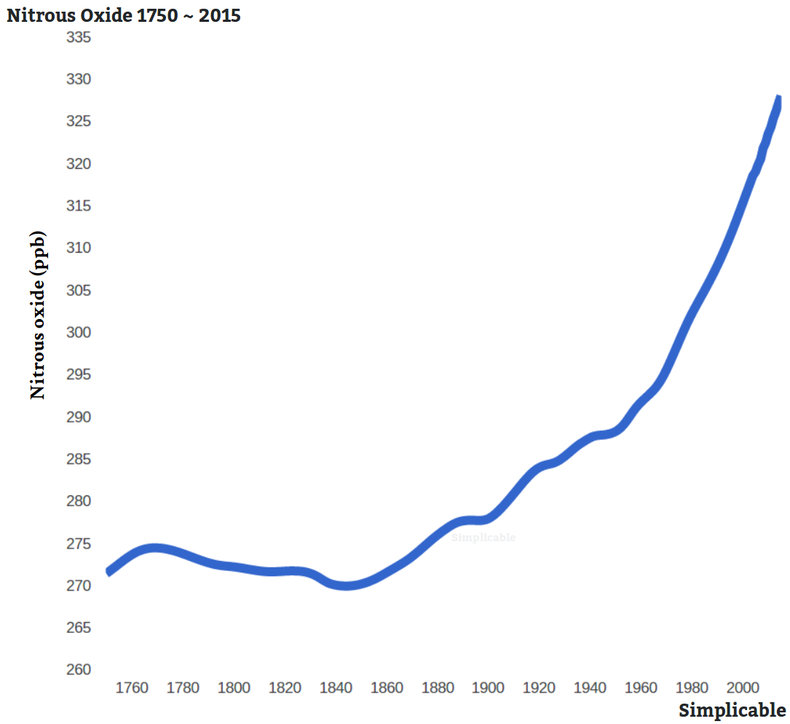
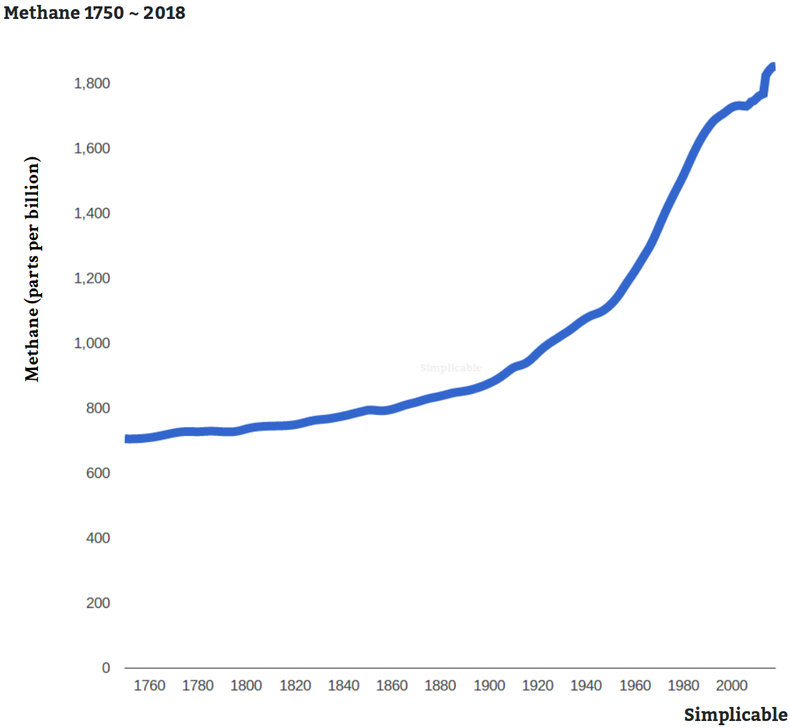
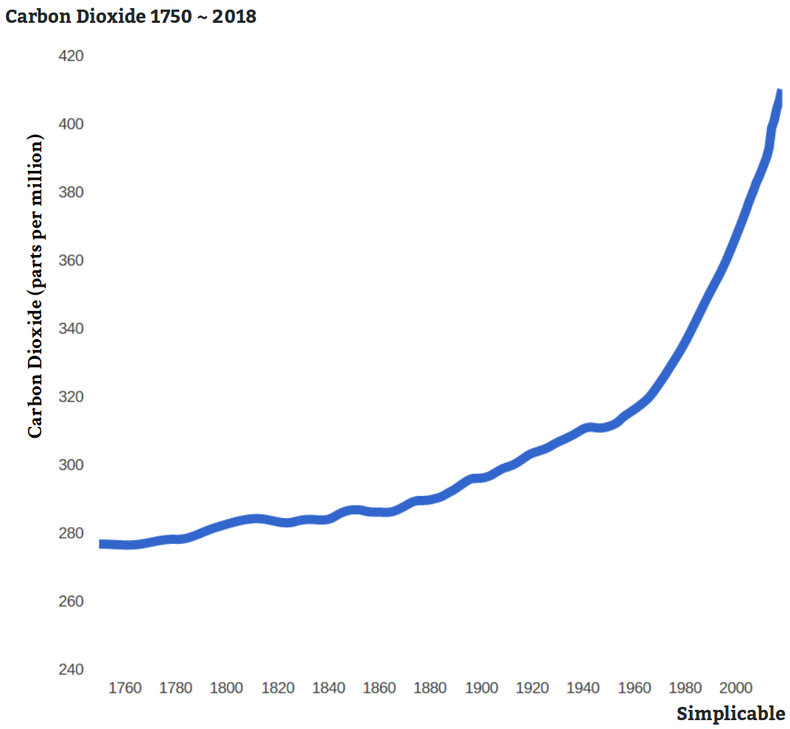
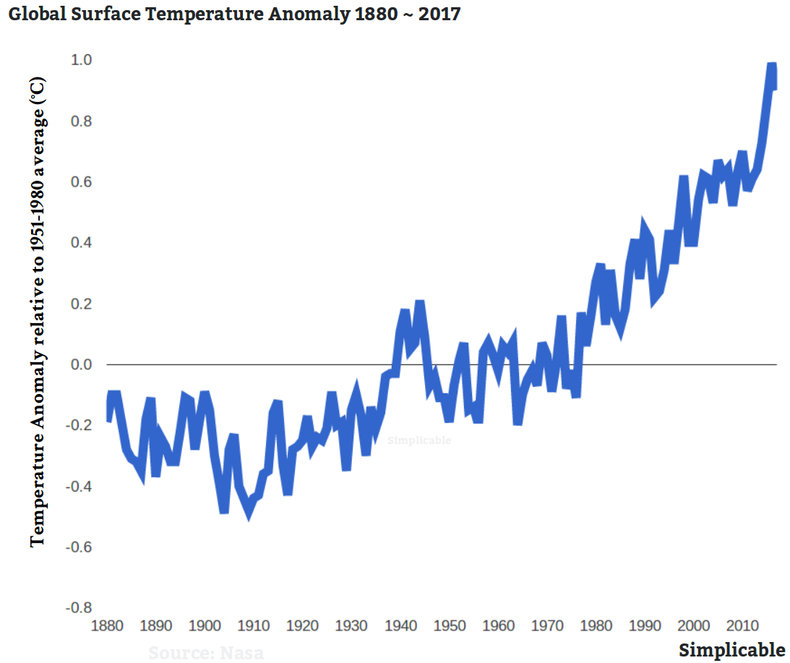
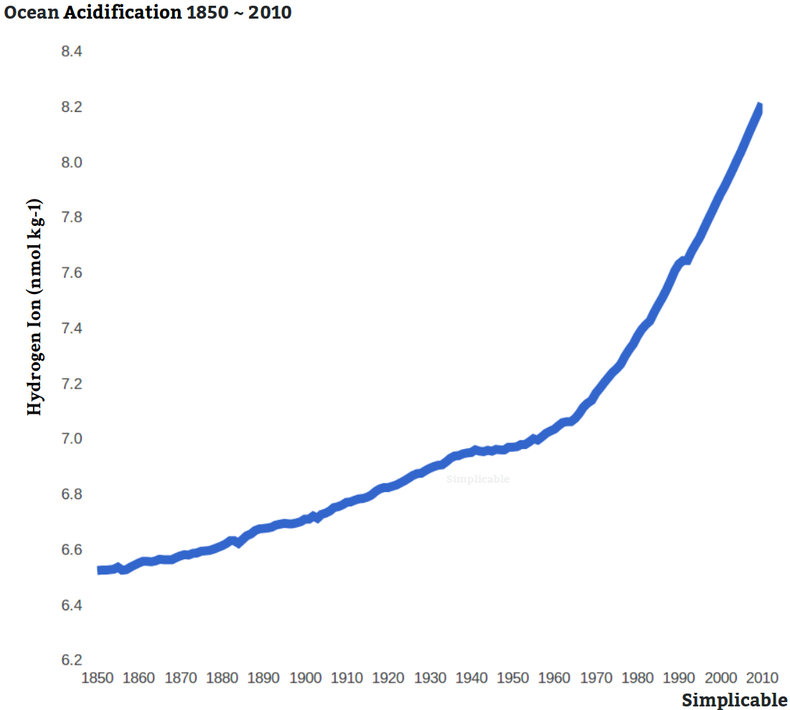
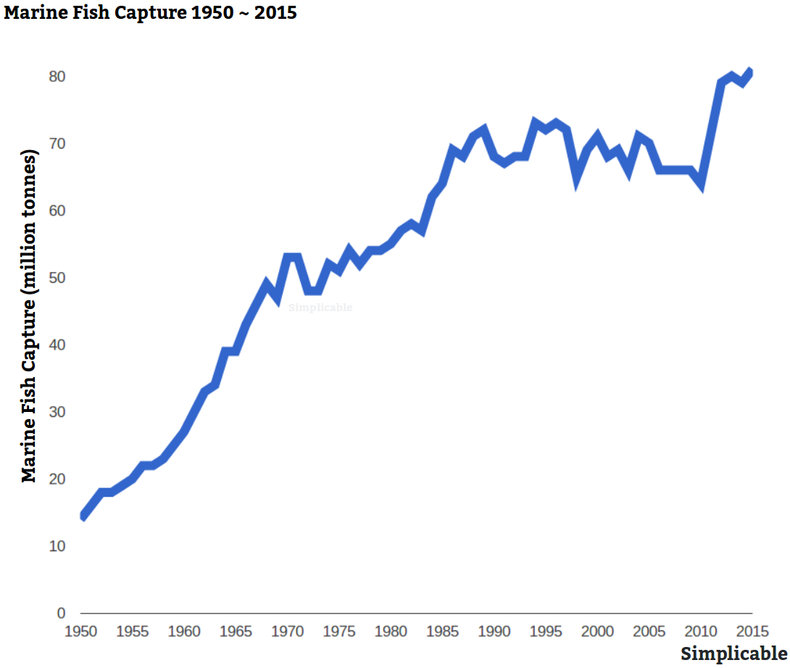
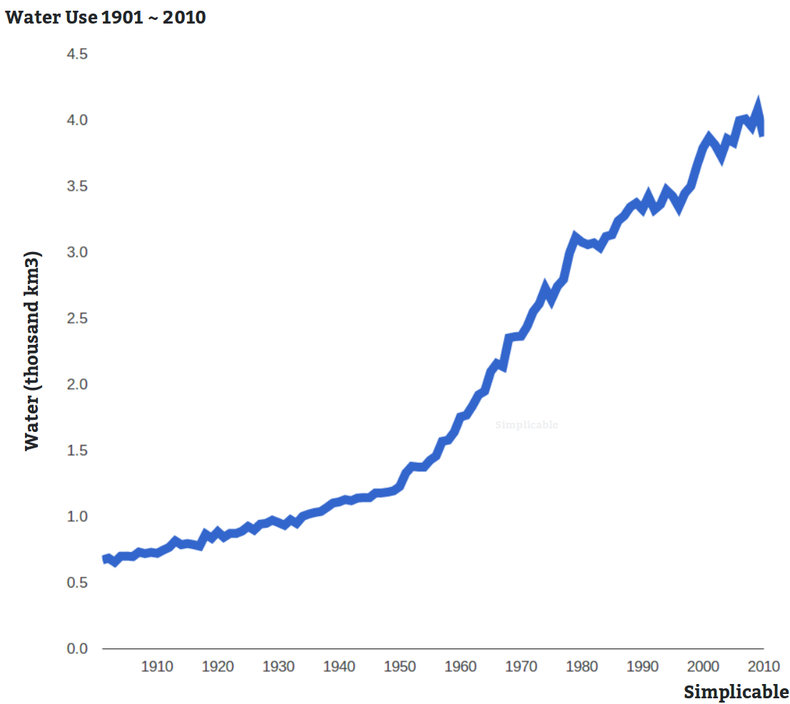
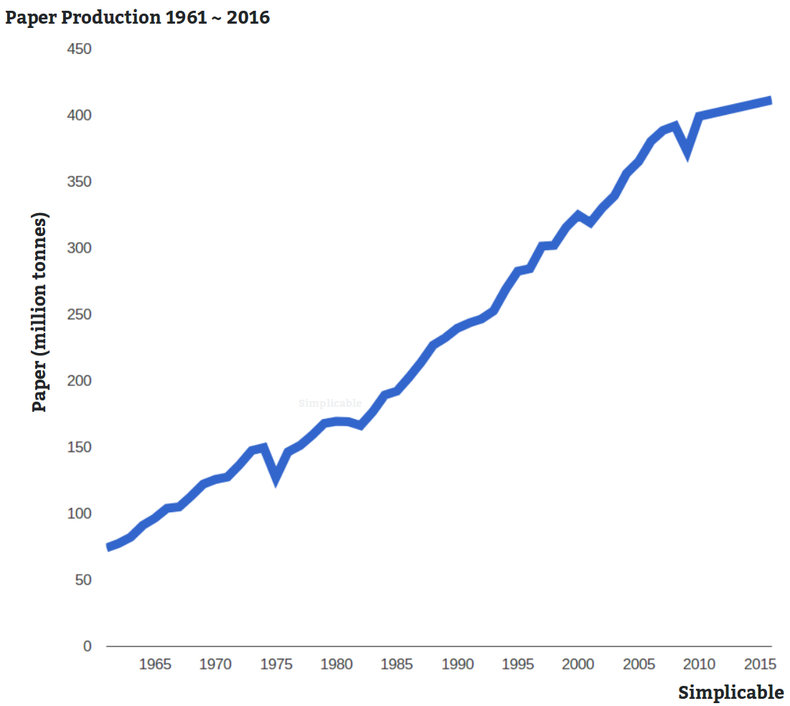
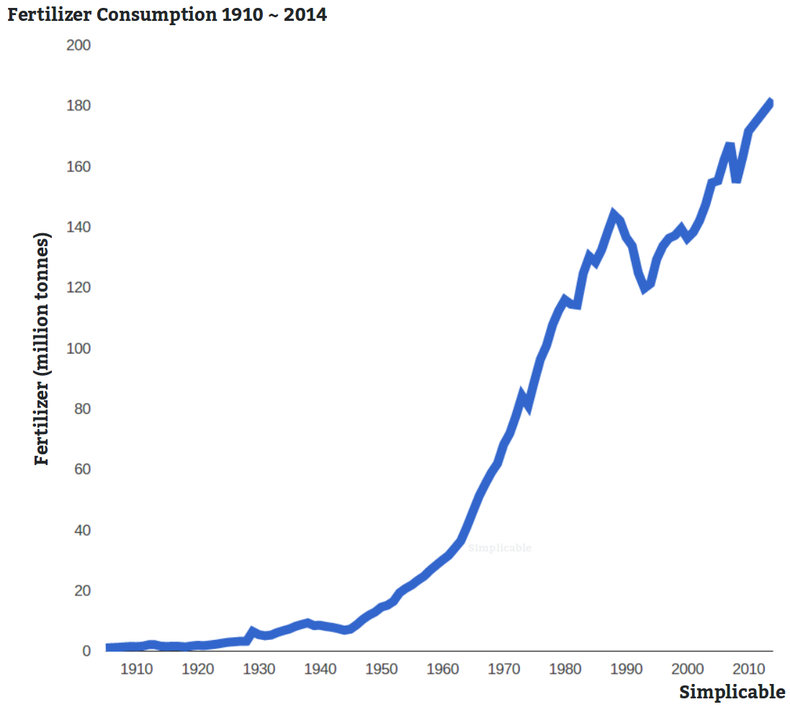
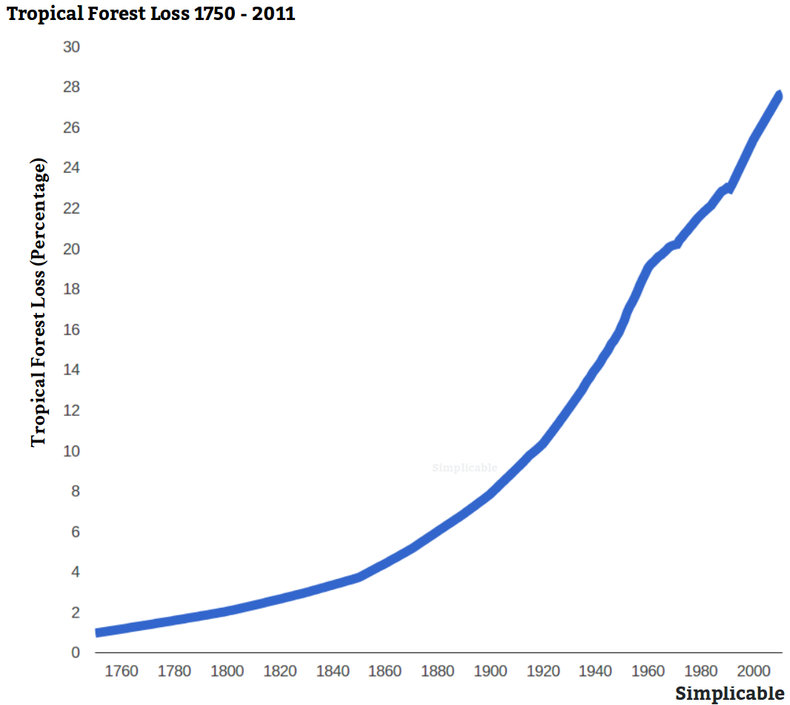
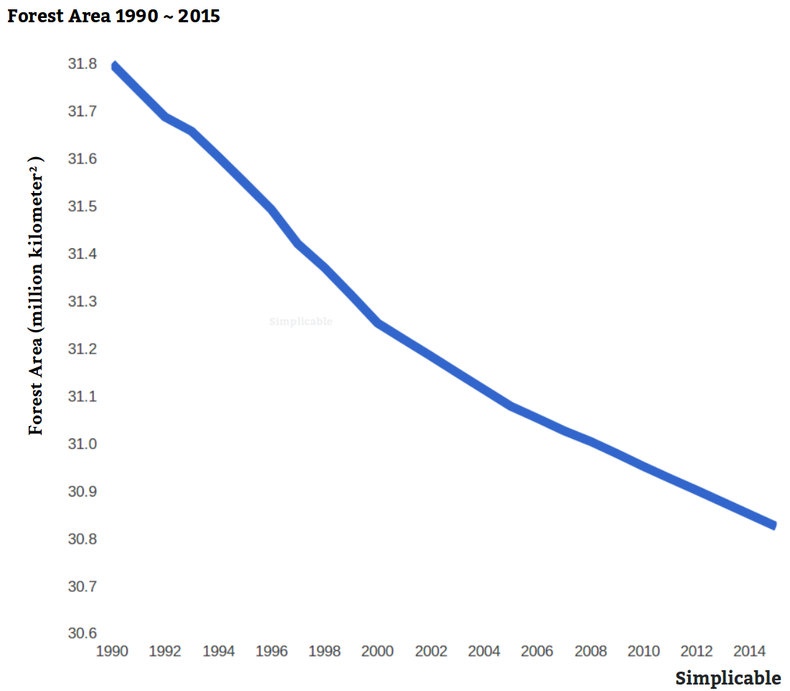
GDPIn 1980, world GDP was 27.952 trillion this grew to 76.681 trillion by 2016 (constant 2010 dollars). This represents a growth rate of 274% meaning that GDP adjusted for inflation almost tripled in the span of 36 years.Note: chart above is in 1990 international dollarsInternational TouristsBetween 1950 and 2016 international tourist arrivals rose from 25.3 million to 1.235 billion. This is an increase of 4,881%.Energy UseGlobal energy use increased from 148.19 exajoules in 1958 to 533.37 exajoules in 2008. In other words, energy use more than tripled in 50 years.Nitrous OxideOver the past 800,000 years, concentrations of nitrous oxide in the atmosphere rarely exceeded 280 ppb. Levels began to rise with the industrial revolution beginning around 1860. By 2015, they were 328 ppb, or about 17% higher than the historical 280 ppb level.MethaneMethane in Earth's atmosphere has more than doubled from 875 ppb in 1900 to 1850 ppb in 2017. Carbon DioxideCarbon dioxide in the Earth's atmosphere has increased from 296 ppm in 1900 to 406 ppm in 2017. This represents an increase of 37%. Global TemperatureAverage global temperatures relative to the 1951-1980 average. In the entire period 1880 - 1939 there wasn't a single year warmer than this average. Currently, there hasn't been a year colder than this average since 1976 with every year after that being warmer than average in an ever increasing pattern. In 2017, it was 0.9°C warmer than average.Ocean AcidificationOcean acidification has increased from 6.9695 nmol kg-1 in 1950 to 8.2111 nmol kg-1 in 2010 (expressed as global average surface hydrogen ion concentration).Marine Fish CaptureMarine fish capture increased by 578% from 14 million tonnes in 1950 to 81 million tonnes in 2015.Water UseWater use increased from 0.721 thousand kilometers3 in 1910 to 3.871 thousand kilometers3 in 2010. This is more than a fivefold increase.Paper ProductionPaper production increased more than fivefold between 1961 and 2016 from 74 million tones to 411 million tonnes.Fertilizer ConsumptionFertilizer consumption increased from 1.654 million tonnes in 1914 to 181.9 million tonnes in 2014. This is an 100 year increase of 10,997%.Tropical Forest LossTropical forests have declined in size since 1700 with total loss at 27.66% by 2011.Forest AreaForest area declined by more than 3 percent from 31.8 million kilometers2 in 1990 to 30.8 million kilometers2 in 2015.|
Type | | Definition | Changes to the environment, economy and human society that occur at planetary-scale. | Related Concepts | |
Change Management
This is the complete list of articles we have written about change management.
If you enjoyed this page, please consider bookmarking Simplicable.
An overview of sustainability with examples.
The definition of economic security with examples.
A list of the common characteristics of sustainable materials.
The definition of downward spiral with examples.
A list of common core values with examples.
The definition of natural resources with examples.
The definition of green industry with examples.
The definition of environmental justice with examples.
The common types of change.
A definition of change agent with examples.
The definition of change driver with examples.
The definition of status quo with examples.
The definition of resistance to change with examples.
The definition of continuous change with examples.
An overview of culture change with examples.
An overview of organizational change communication with examples.
The four types of organizational change with examples of each.
TrendingThe most popular articles on Simplicable in the past day.
Recent posts or updates on Simplicable.
Site Map
ReferencesUnited Nations, DESA. World Population Prospects: The 2017 Revision.United Nations Population Division, DESA. World Urbanization Prospects: 2018 Revision.IGBP synthesis: Global Change and the Earth System, Steffen et al 2004.Nordhaus.The economics of new goods. University of Chicago Press, 1997.A. Grubler, International Institute for Applied Systems Analysis (IIASA); Grubler et al. 2012.Food and Agriculture Organization of the United Nations, World fertilizer trends and outlook to 2018.World Tourism Organization, 2016 Annual Report.FAOSTAT. 2017. Database of the FAO (Food and Agriculture Organization of the United Nations).MacFarling Meure, C., Etheridge, D., Trudinger, C., Steele, P., Langenfelds, R., van Ommen, T., Smith, A. and Elkins, J. (2006). The Law Dome CO2, CH4 and N2O Ice Core Records Extended to 2000 years BP. Geophysical Research Letters, Vol. 33, No. 14.EPA, Climate Change Indicators: Atmospheric Concentrations of Greenhouse Gases, 2018.Etheridge D. M., Steele L. P., Francey R. J. and Langenfelds R. L. 1998, Atmospheric methane between 1000 A.D. and present: evidence of anthropogenic emissions and climatic variability, Journal of Geophysical Research, 103.James Orr, LSCE/IPSL, France; Bopp et al. 2013 and IPCC Fifth assessment report, Working Group 1, Chapter 6 (Ciais et al. 2013).FAO Fisheries and Aquaculture Department online, World capture production. World Bank, Food and Agriculture Organization, Forest area, 2018.
© 2010-2023 Simplicable. All Rights Reserved. Reproduction of materials found on this site, in any form, without explicit permission is prohibited.
View credits & copyrights or citation information for this page.
|
