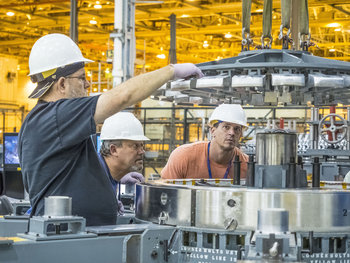
A-Z Popular Blog Management Search »
Management
 Advertisements
Related Guides
Management Theory

Management Functions

Change Management

4 Examples of a Fishbone Diagram

 , updated on
A fishbone diagram is a visualization of the causes of a problem. As the term suggests, the diagram looks like a fishbone with each bone representing a category of root cause. This discourages the common tendency to assign a single root cause to problems that may have deeper causes such as a human error that could have been prevented with controls. The following are illustrative examples of a fishbone diagram.

Operations Outage

A production line goes down for three shifts due to a failed machine. A root cause analysis determines that the machine had multiple design issues. Such problems weren't detected or mitigated by maintenance processes. When the machine needed to be replaced, several issues complicated the process making the outage longer.
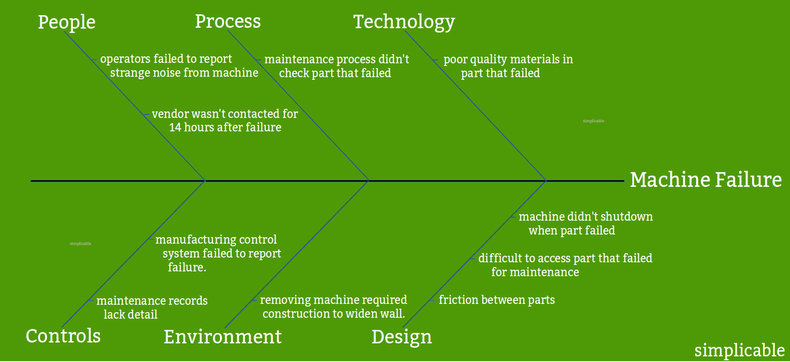
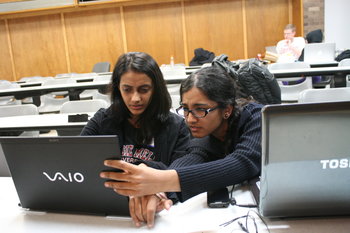
Service Outage

A software service experienced an outage after a bug that was missed in testing was launched to production. The procedures required to fix the problem did not go smoothly as backout procedures failed and developers had trouble accessing environments due to issues with security keys.
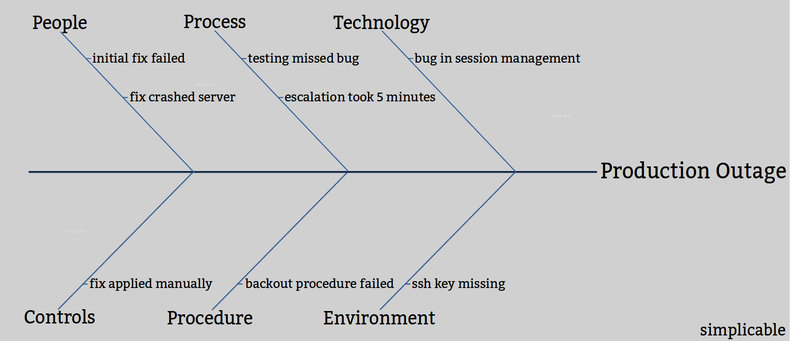
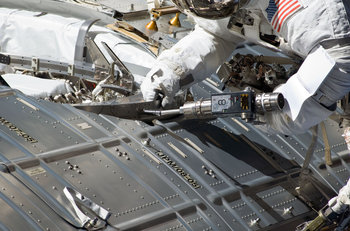
Quality Failure

A customer finds a problem with a product that had passed quality control. A quality assurance investigation reveals that a machine error caused the defect. Quality control tests and processes failed to detect the problem.
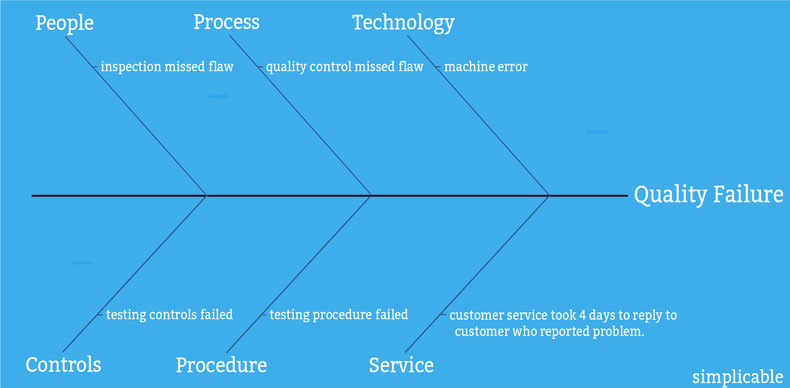
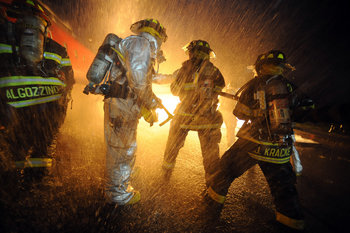
Security Incident

A worker loses a laptop filled with company data at a bar. The incident investigation discovers a lack of policy and procedure to prevent such problems. Root cause analysis also reveals technical shortcomings such as weak encryption, a poor password policy and lack of an audit trail for data.
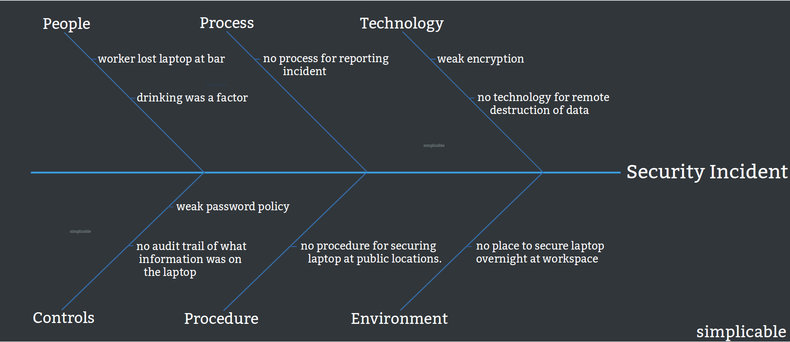
Overview: Fishbone Diagram
Type
Definition
A visualization of the causes of a problem.
Also Known As
Invented By
Kaoru Ishikawa
Related Concepts

Incident Management

This is the complete list of articles we have written about incident management.
Business Incident
Call Tree
Corrective Action
Downtime
Escalation
Help Desk
Incident
Incident Process
Incident Response
Mean Time To Repair
MTBF
MTTR
Problem Management
Revenue Impact
Root Cause
Self Service
Service Desk
Service Management
Service Support
SLA
Support Levels
Trouble Ticket
Troubleshooting
More ...
If you enjoyed this page, please consider bookmarking Simplicable.
 

Problem Management

The definition of problem management with examples.

Ishikawa Diagrams

The definition of ishikawa diagram with examples.

Incident vs Problem

The difference between incidents and problems explained.

Problem Analysis

Common problem analysis techniques.

Business Incident

The definition of business incident with examples.

Incident Management Process

An overview of the incident management process with examples.

Problem Management Process

An overview of the problem management process.

Service Delivery Examples

An overview of service delivery with examples.

Help Desk

An overview of help desk with examples.

Accountability Measures

A list of common accountability measures.

Incident Response

An overview of incident response with examples.

Quality Assurance

A few quality assurance techniques.

Quality Assurance Definition

Definitions of quality assurance.

Quality Assurance vs Quality Control

The difference between quality assurance and quality control.

Quality Assurance Examples

An overview of quality assurance with a few examples.

Continuous Improvement

A definition of continuous improvement with examples.

Quality Policy

A list of common elements of a quality policy.

Acceptance Criteria Examples

A definition of acceptance criteria with examples.

Quality Goals

Examples of measurable quality goals.
The most popular articles on Simplicable in the past day.

New Articles

Recent posts or updates on Simplicable.
Site Map