Numbers Over Scales
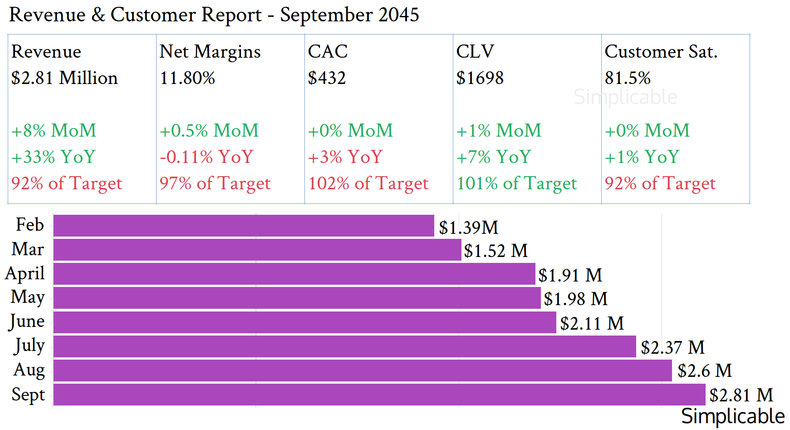
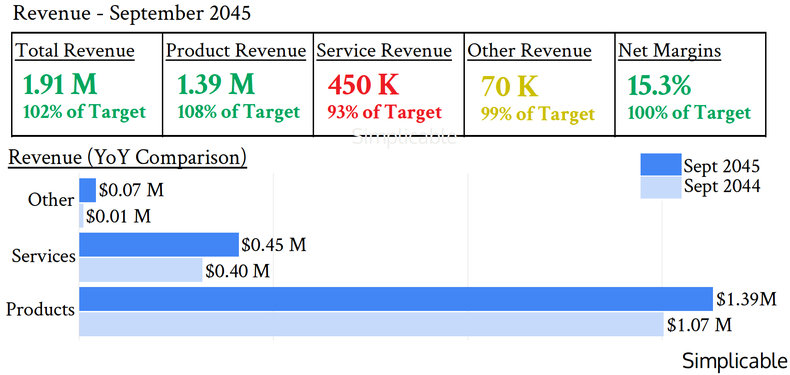
A management report clearly communicates numbers for targets. This can be augmented with percentages relative to targets, month-over-month and year-over-year results. Never make your audience try to figure out numbers from the scale on a graph. For example, the following report includes clear numbers for revenue, net margins, customer acquisition cost, customer lifetime value and customer satisfaction rate.
Color Is Information
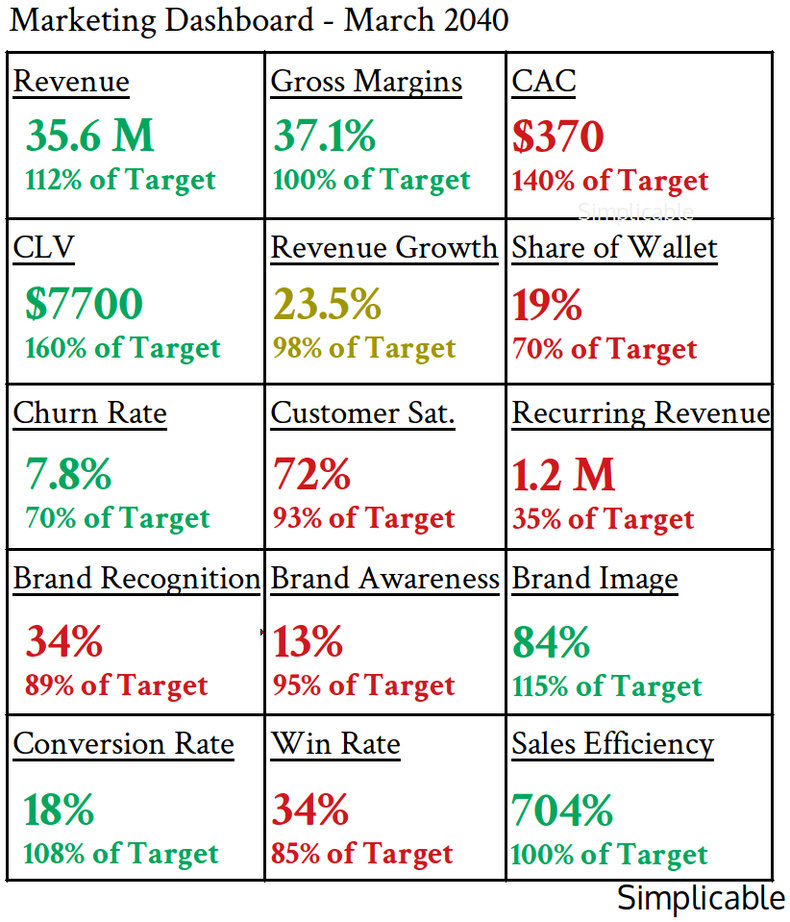
Management reports are critical internal communications whereby information is prioritized over aesthetics. As such, color is not used to decorate but to communicate status such as a rag status. Color can also be used to differentiate between information elements such as the bars or lines in a chart.
Information Density
It is common for senior and executive managers to have a preference for information density whereby they want to see as much information as possible in a single screen. This can be achieved with non-graphical dashboards that give nothing but metrics with a rag status for each based on targets.
Textual Information
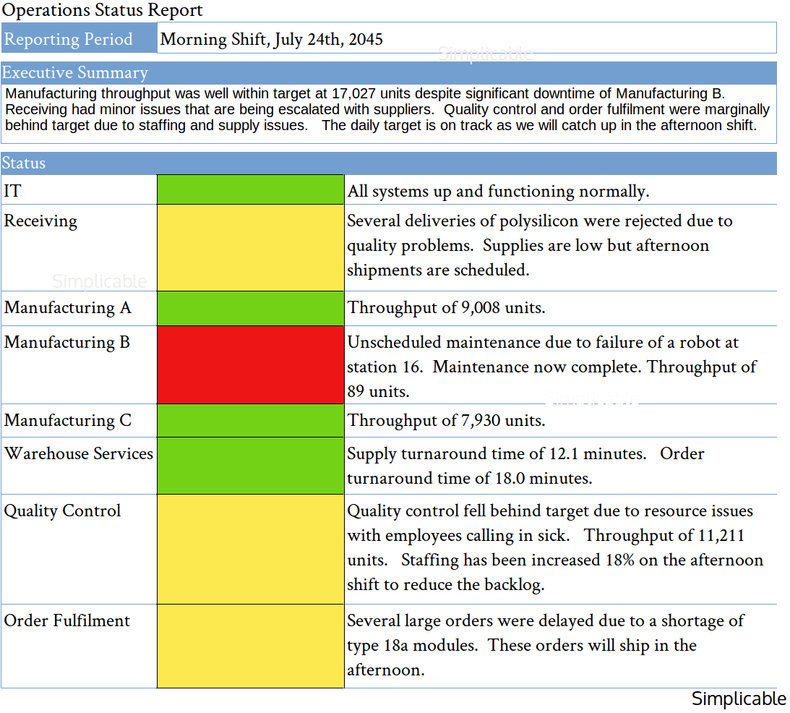
Management reports commonly include textual information to communicate business conditions and results. In many cases, language is far more efficient than a visual in providing details of issues, status and risk. For example, an operations status report might explain any problems that are flagged by the report and plans to overcome problems.
| Overview: Management Reports | ||
Type | ||
Definition | A communication of business results, issues, status and risk created by managers for an audience of managers, executive management or governance bodies. | |
Related Concepts | ||


