3D
Unnecessarily expanding 2D information into a 3D visualization.Textures & Gradients
Using distracting textures and gradients as opposed to solid colors.Illustrations as Data
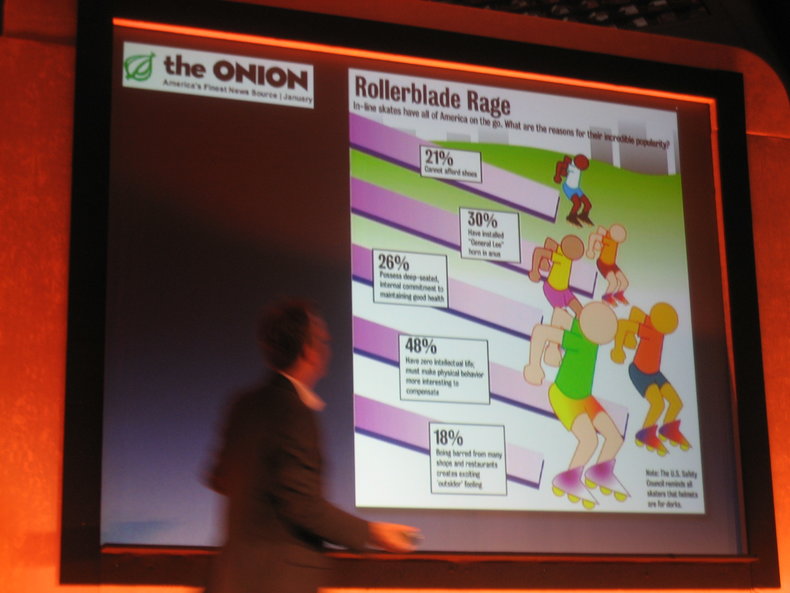
Illustrations of different sizes to represent data as opposed to a standard representation such as a line graph. For example, a graph that displays different sizes of dollar bill to represent costs.Backgrounds
Background illustrations or photographs that distract from data elements.Colors as Data
Using a complex color scheme other than a heatmap to convey data without numbers.Two in One
Attempting to put two or more charts into one such that comprehension is unnecessarily difficult and error prone.Additional Information
Including non-essential information into a chart such as interesting facts.Conventions
Disregarding data visualization conventions. For example, a bar chart with tilted or inverted bars.| Overview: Chartjunk | ||
Type | Data Visualization | |
Definition | Unnecessary information and decorations that make a data visualization more difficult to comprehend with speed and accuracy. | |
Related Concepts | ||


