


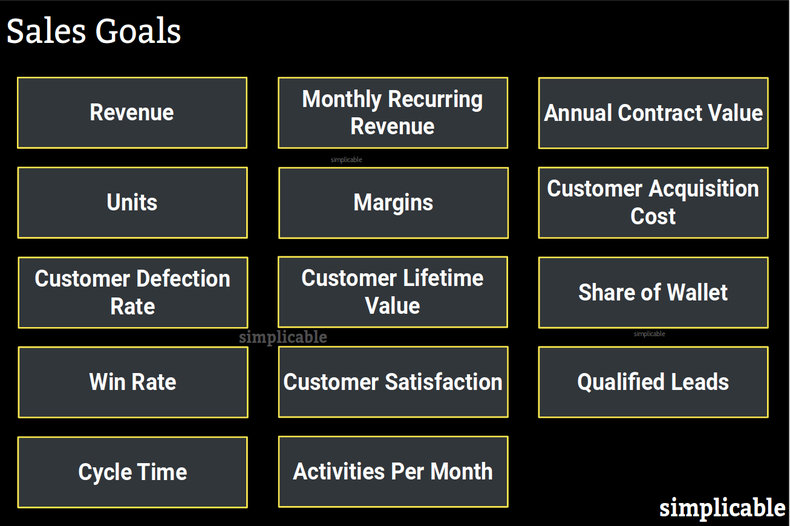
Revenue
Revenue targets for products, teams and sales people. These are often incentivized with a system of sales quotas whereby commissions are higher for sales people who meet monthly, quarterly and annual targets. For example, a salesperson may have a base salary, a 2% regular commission rate and a 4% commission for each month they exceed a quota of $270,000 in revenue.Monthly Recurring Revenue
Sales of services and subscriptions may have targets based on monthly recurring revenue (MRR). For example, a salesperson with a quota of $20,000 in monthly recurring revenue with a commission of 10% of MRR if they miss quota and commission of 50% of MRR if they hit quota.Annual Contract Value
Recurring revenue or long term contracts may be converted to an annual measurement known as annual contract value for the purpose of targets and commissions. For example, a salesperson may have a monthly target of $400,000 in annual contract value. To convert monthly recurring revenue to annual contract value you multiply by 12. For example, $7000 in monthly recurring revenue represents an annual contract value of $84,000. One time sales such as an initial cost of $48,000 can simply be added to annual contract value. This allows targets to include both recurring and non-recurring revenue as a single number.Units
Revenue goals may be stated in units. For example, a luxury car salesperson who is given a target to sell 20 vehicles in a quarter.Margins
Where prices are negotiated, sales managers may be given gross margin targets. This requires the manager to balance revenue targets with the need for sales to be profitable. For example, a sales manager in an industrial equipment firm may be given an annual gross margin target of 40% together with a team sales target of $40 million.Customer Acquisition Cost
Customer acquisition cost is the cost to close a deal with a customer including all marketing and sales costs that can be attributed to the deal. This may include all salaries and commissions paid to sales people and is a way to measure the cost of the end-to-end marketing and sales process. For example, a solar panel systems sales team that has a target average customer acquisition cost of $2400.Customer Defection Rate
The percentage of your customers who cancel their service or fail to make a regular purchase. For example, a consulting sales team with a target to reduce monthly customer defections from 3% of customers to 2%.Customer Lifetime Value
If a sales team are responsible for maintaining customer relationships it is common to give teams and salespeople a target for the estimated value of their accounts expressed as customer lifetime value. This captures initial sales, upselling, cross-selling and customer retention efforts in a single metric. For example, a telecom services sales team may target an 18% improvement in customer lifetime value by upselling new services and improving customer satisfaction to reduce cancellations.Share of Wallet
The percentage of a customer's total spend in a product category that goes to your products. For example, an IT services company may target an average of 7% share of wallet by building relationships at large firms to upsell. Share of wallet is also known as account penetration.Win Rate
The percentage of opportunities, quotes or proposals that are closed. For example, a solution sales team may target at win rate of 30%.Customer Satisfaction
If sales people are the primary contact point with customers such that they represent your product and brand they may be evaluated based on customer satisfaction. For example, a cloud software salesperson who is expected to be visible when customers have a question or problem to sustain customer relationships may have a target of 80% customer satisfaction.Qualified Leads
The number of qualified leads generated in a quarter. Ensures a full pipeline of opportunities. It is also common to set a target for the average quality of leads. For example, a sales operations team with a target to generate 100 qualified leads a month with a score of at least 77% on a qualification scale.Cycle Time
The average time it takes from lead-to-opportunity, opportunity-to-close or lead-to-close. For example, a sales team with a target opportunity-to-close of 3 weeks. This is a secondary metric that isn't often taken too seriously but can indicate the amount of effort that is taken to move all opportunities forward.Activities Per Month
The sales activities per month of a sales person or team. This may be all activities or specific types of activities. For example, a sales person with a target of 25 customer visits per month.| Overview: Sales Goals | ||
Type | ||
Definition | Targets that are used to measure sales strategy and performance. | |
Related Concepts | ||